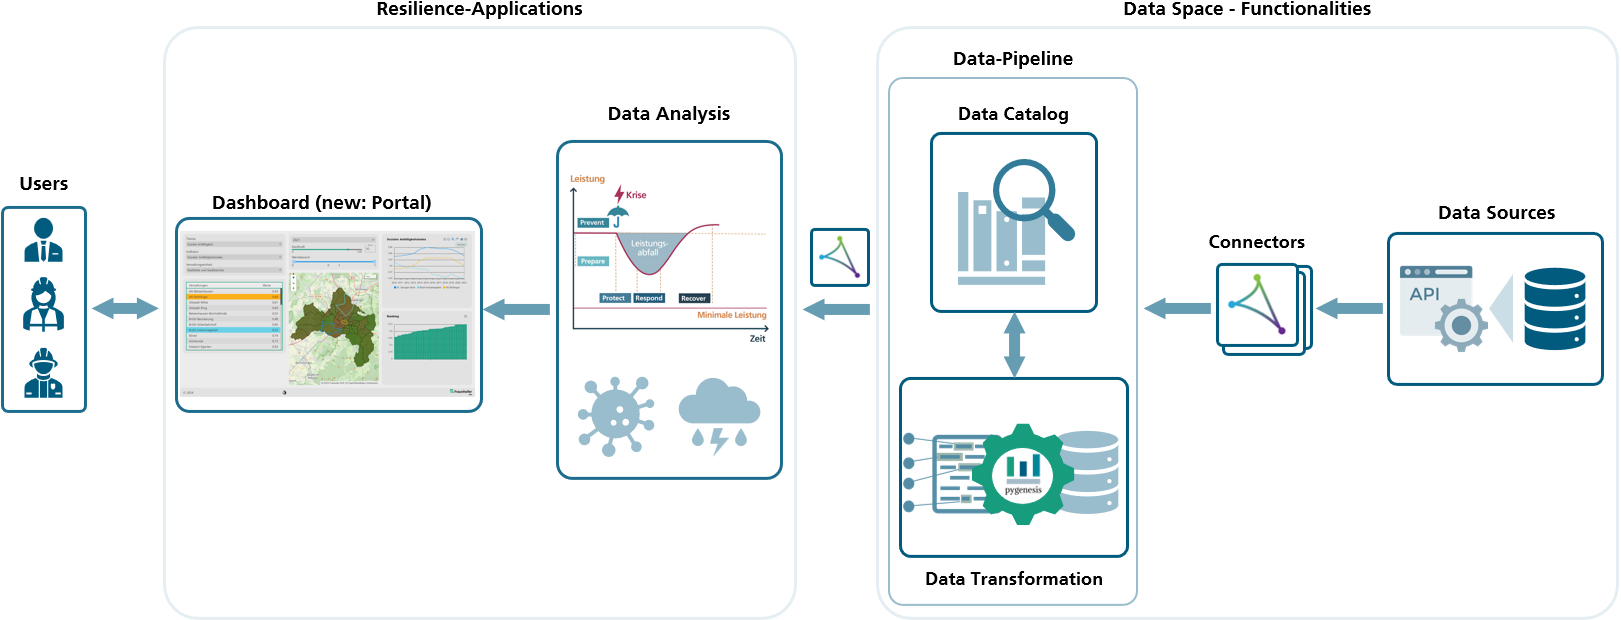
Project Results

HERAKLION-Portal
Allows public access to the data room. Through authentication, a registered user gets access to the resilience dashboard, data exploration and connectors. Access is specified using appropriate user roles.
Data Analysis
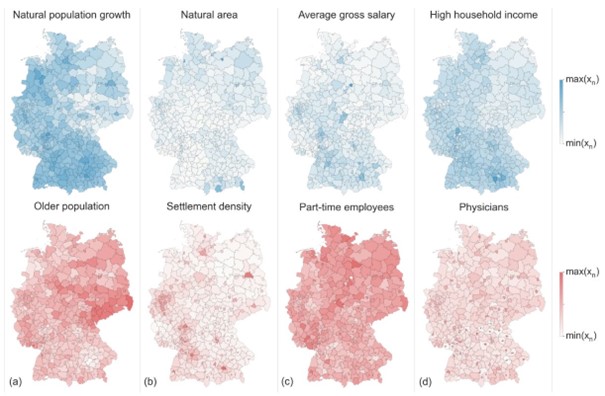
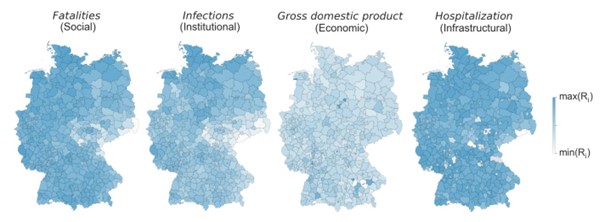
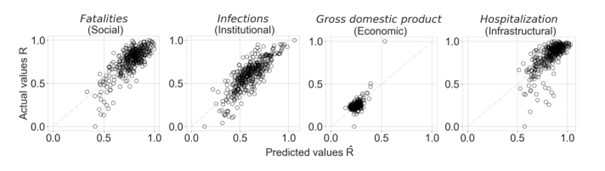
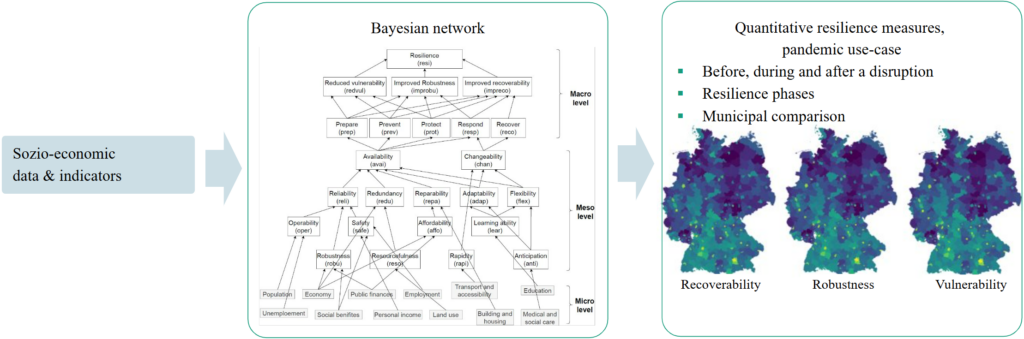
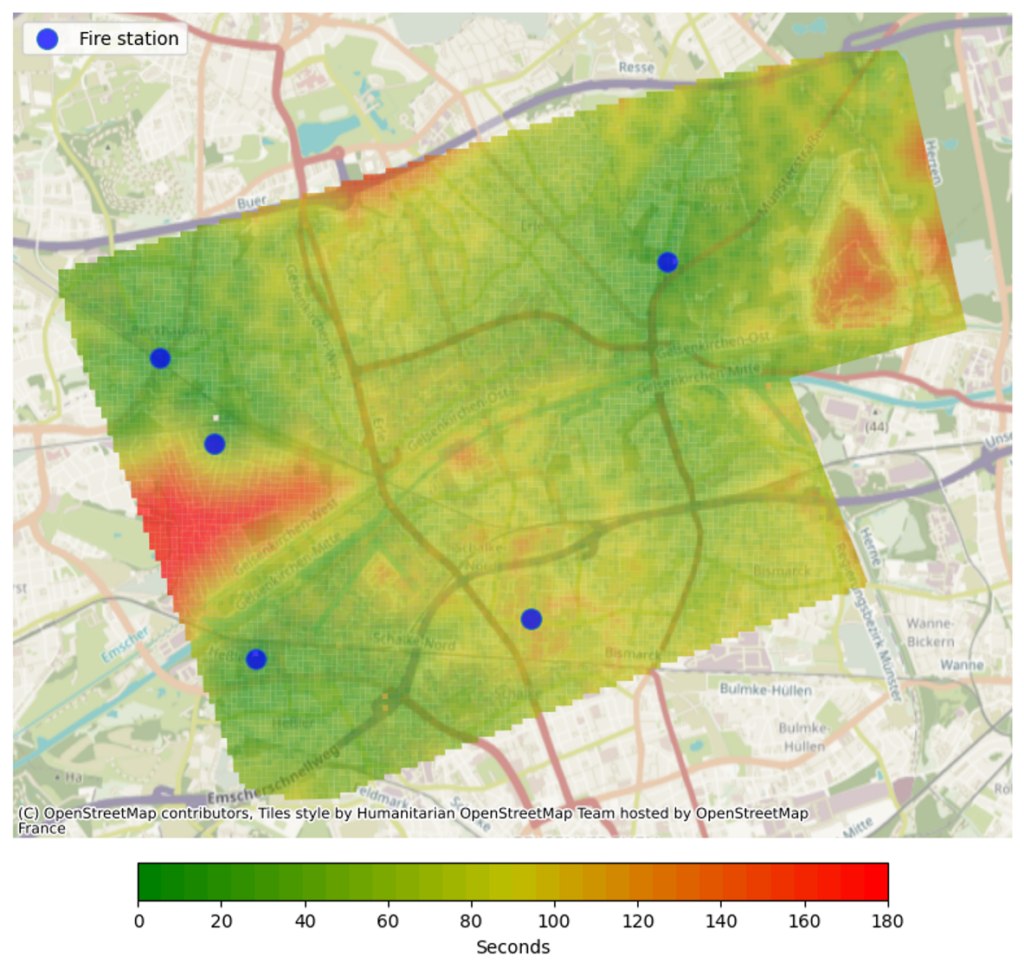
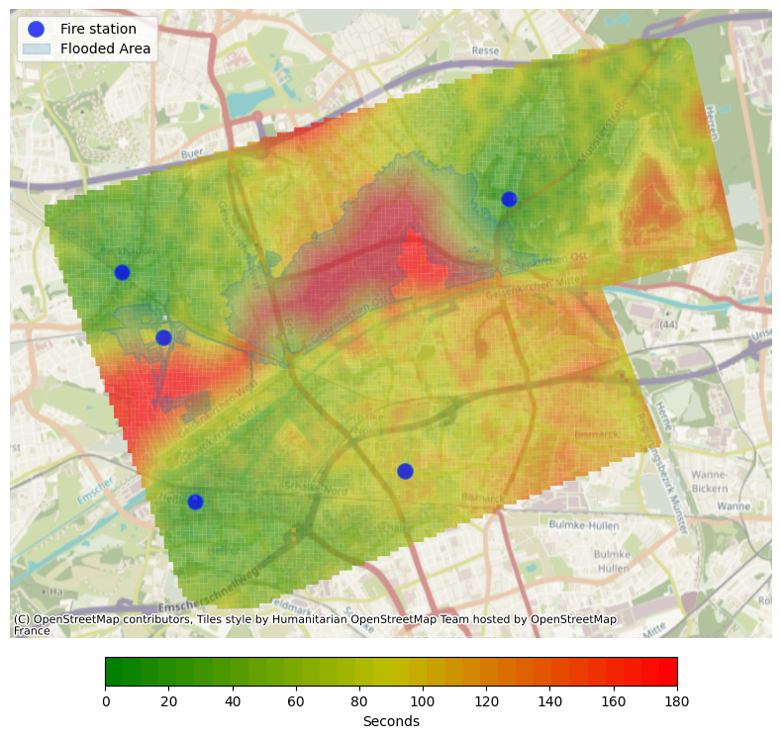
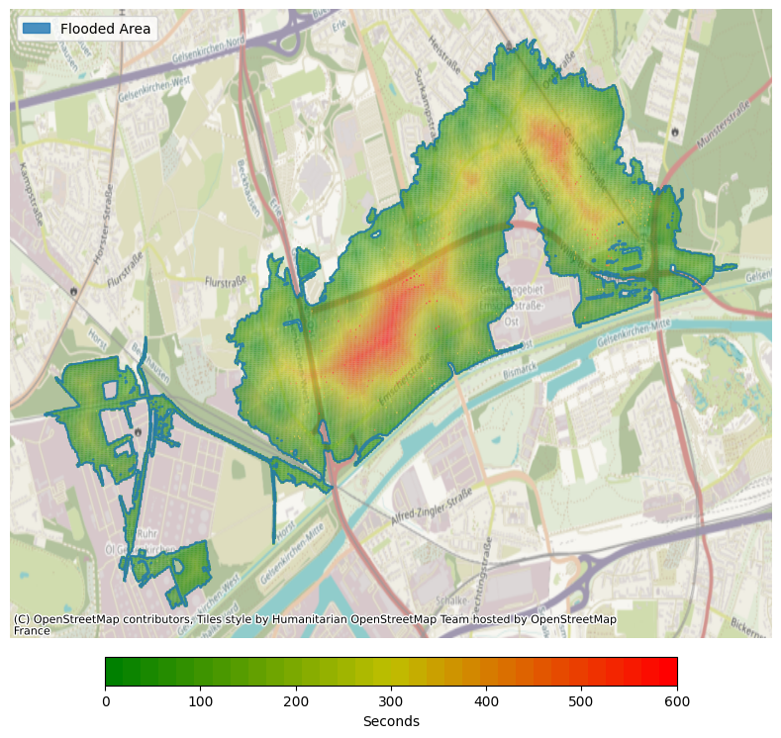
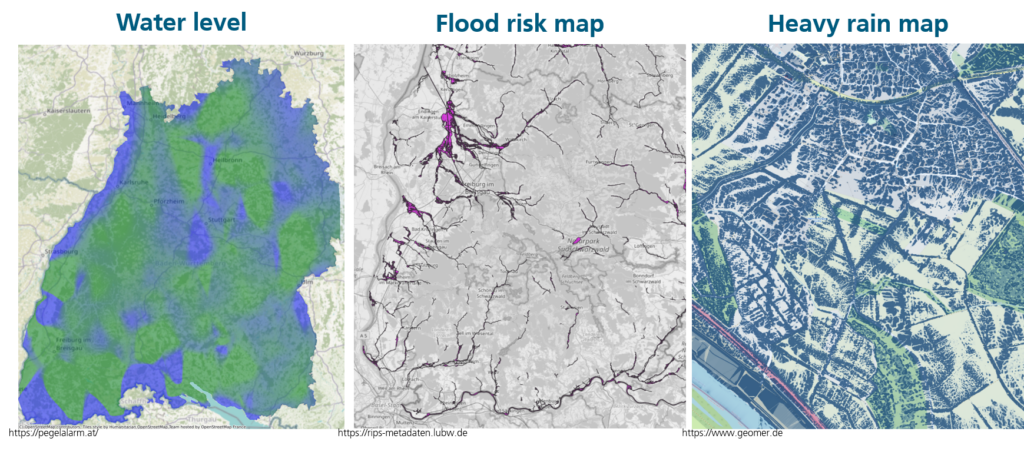
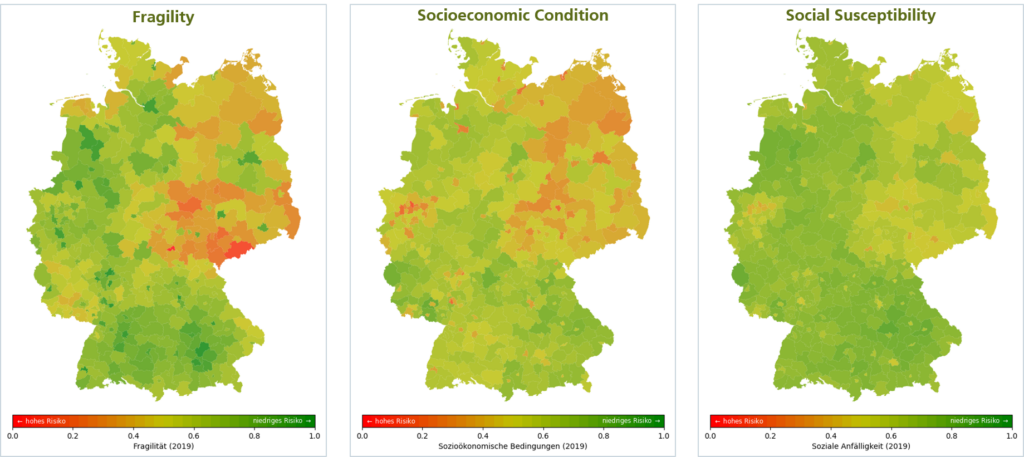
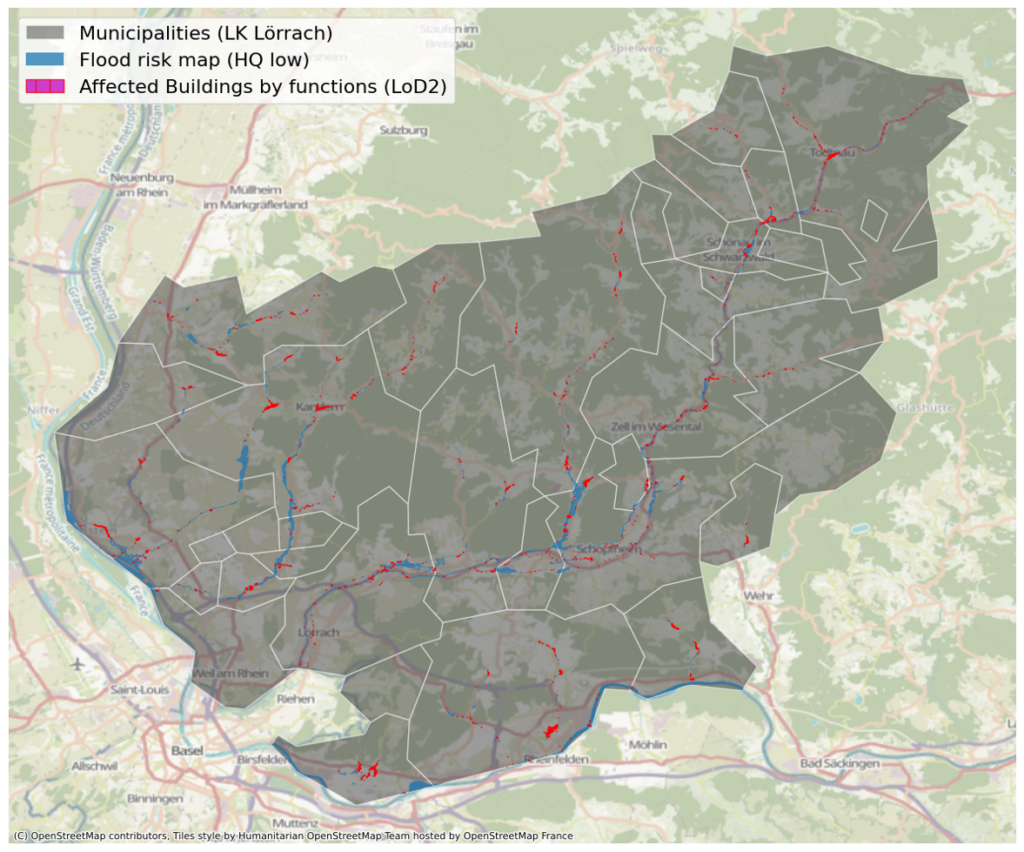
In the HERAKLION project, data analysis is used to assess the vulnerability, resilience and availability of critical infrastructure in crisis situations. Both vulnerable areas and potential weaknesses in the infrastructure systems are identified. Statistical methods and machine learning are used to uncover relationships between different variables to understand the impact of crises on infrastructure security. The analysis takes into account both historical data and time-dependent events to assess the recovery ability and resilience of communities under crisis conditions. Combined with route analysis, it offers support in planning crisis scenarios and optimizing evacuation measures.
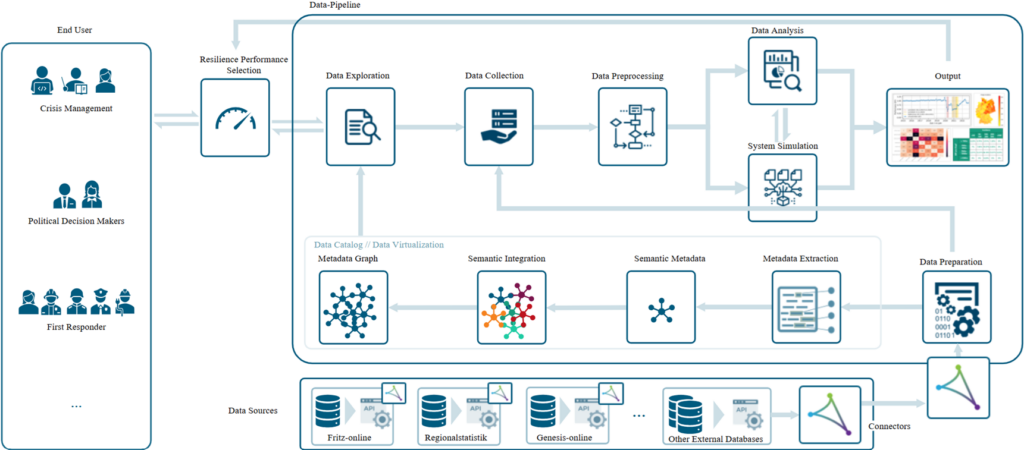
Data-Pipeline
New available data sets flow into the data pipeline, where their format becomes unified. Missing and additional metadata are also extracted. The metadata is then stored in the data catalog in the form of a knowledge graph. The data catalog enables quick and efficient searching of all data sets and complex analyses.
Connectors
Connectors are central elements for the exchange of data between the actors in the data space. They ensure structured data exchange in compliance with strict sovereignty standards to enable decentralized management and multilateral use of data. The Heraklion connector is based on the Eclipse Dataspace Components, which were developed for interoperability and secure data exchange. These components are important for a robust data exchange infrastructure and enable seamless integration between different systems.

HERAKLION Portal

Allows public access to the data room. Through authentication, a registered user gets access to the resilience dashboard, data exploration and connectors. Access is specified using appropriate user roles.

https://heraklion.emi.fraunhofer.de

Data-Pipeline and Data Catalog

Data Pipeline

The data pipeline is the link between data providers and the data catalog. The pipeline continuously checks whether data providers are supplying new or modified records. It aggregates these records and transforms the metadata into the DCAT vocabulary. Additionally, resilience-specific metadata is calculated to describe data quality, for example, and to enable resilience analyses.

Data Catalog

The data catalog stores the metadata in a knowledge graph. This enables quick and efficient searching of records from all data sources. Additionally, it allows for complex queries and analyses.

Data Analysis

Pandemic

The aim is to use the available data to find out which characteristics of a community indicate a positive or negative influence on resilience.

Variables that describe the characteristics of a municipality before the pandemic.

Resilience, which is determined by various performance indicators during the pandemic.

Bayesian network analysis of socio-economic data

Availability analysis of PoIs for flood events

Availability analyses support deployment planning for crisis events. These determine the travel time from important facilities, such as fire stations, to any location in the area under consideration. Travel times for the shortest route are determined with the help of map services. For comparison, availability is calculated in normal situations and in hazardous situations such as flooding. This means that detours due to flooded traffic routes are also taken into account in the analysis.

Normal situation

Flooded situation

Access analysis for evacuation

The access analysis for evacuation plans determines the shortest route from a location to safely leave the affected area and calculates the walking time required.

Indicator-based data analysis for extreme weather

The indicator-based analysis is carried out on three levels: At the macro level, the index summarizes all indicators and is modeled to assess vulnerability and resilience. At the meso level, the index consists of several indicators that integrate specific characteristics and data. At the micro level, the indicator is composed of individual factors such as education level or health care. The main indicators include socioeconomics, environment and the accessibility of critical infrastructure.

The environmental indicator uses various environmental factors to identify potential hazards. It takes into account both static and time-dependent variables, including topography and geography, climate data and hydrodynamic data.

The social indicator examines vulnerable population groups and potential monetary damage caused by crises. It tracks high-risk regions to identify vulnerabilities and analyzes resilience phases and dimensions to improve prevention and preparedness. Variables from the areas of population and age structure, housing situation, education and job market are taken into account.

Indicator-based data analysis for extreme weather

The analysis determines the potentially flooded buildings using flood and heavy rain maps and assigns their function to the critical infrastructure sectors and the resilience dimensions.

Buildings grouped by resilience dimensions (TOSE)